
Chapter 2: Training Simple Machine Learning Algorithms for Classification
Perceptrons
Modeled after a single neuron, it initially was designed to be able to classify in one of two categories. It would send data through a unit step function that forced the value into either -1 or 1 (sign function) based on the 0 threshold.
Rosenblatt made the first one. Its rules were simply:
- Initialize weights to 0 or small random numbers
- Foreach training sample in x
- Compute the output value y
- Update the weights
Weights were adjusted by adding their delta /\w. Where /\ is supposed to look like a triangle for a delta in text..
w = w + /\wThe delta was calculated by
/\w = learningRate * (trueLabel - guessedLabel) * input
/\w = lr           * (y         - gy          ) * x
We can see that in correct guesses the delta is always zero
/\w = lr * (y - gy) * x
y = -1, gy = -1

lr * (-1 - -1) * x = lr * 0 * x = 0
lr * (1 - 1) * x = lr * 0 * x = 0
And in incorrect guesses the weights are being pushed towards the direction of the positive or negative target class (correct answer).
/\w = lr * (y - gy) * x
y = 1, gy = 1

lr * (1 - -1) * x = lr * 2 * x
lr * (-1 - 1) * x = lr * -2 * x
Lets look at how the the weights would adjust when dealing with different values of input.
If our learning rate was 1 and if the input was x = 0.5 and we incorrectly classified it as -1 we would see:
lr = 1, y = 1, gy = -1, x = 0.5

/\w = 1 * (1 - -1) * 0.5
/\w = (2) * 0.5
/\w = 1
Similarly if the input was x = 2 and it was misclassified as -1 we would see
lr = 1, y = 1, gy = -1, x = 0.5

/\w = 1 * (1 - -1) * 2
/\w = (2) * 2
/\w = 4
We can see that the rate of adjustment increased for far we were from the correct guess. This shows that the weight update is proportional to the value.
Two areas of difficulty for the Perceptron:
- If the learning rate is too large then it can thrash back and forth over the goal classification and fail to classify
- If the problem is not linearly separable it cannot correctly classify it
Perceptron in Python
We will create a perceptron class that utilizes NumPy mathematics to classify a data set of setosa or versicolor iris flowers.
perceptrion.py
import numpy as np

class Perceptron(object):
    # constructor
    def __init__(self, eta = 0.01, n_iter = 50, random_state = 1):
        self.eta = eta
        self.n_iter = n_iter
        self.random_state = random_state

    # training algorithm
    # X: a numpy 2d array of samples and features with a shape (number of samples, number of features
    # y: a numpy array of target labels with shape (number of samples)
    def fit(self, X, y):
        rgen = np.random.RandomState(self.random_state)
        # get a normal distribution
        #   loc = mean of the distribution (center point)
        #   scale = standard deviation of the distribution (the spread / width)
        #   size = number of random numbers returned, default is 1
        self.w_ = rgen.normal(loc=0.0, scale=0.01, size=1 + X.shape[1])
        self.errors_ = []

        # iterate a set number of times to train on the data passed in
        for _ in range(self.n_iter):
            errors = 0

            # iterate the samples and targets
            # since they are the same size we fully iterate both lists
            # xi = is input from sample
            # target = correct answer
            for xi, target in zip(X, y):
                # make a prediction for the xi input vector and calculate the error
                update = self.eta * (target - self.predict(xi))
                # update all weights from element 1 onward with the error times the input
                self.w[1:] += update * xi
                # update weight 0 with only the error (the bias)
                self.w[0] += update
                # track our errors for debugging
                errors += int(update != 0.0)
            self.errors_.append(errors)
        return self

    def predict(self, X):
        # returns x or y based on condition
        return np.where(self.net_input(X) >= 0.0, 1, -1)

    def net_input(self, X):
        # dot product of input vector and weight vector + w0 (the bias)
        return np.dot(X, self.w_[1:]) + self.w_[0]
Given this object we can read a CSV of iris data that contains 150 rows of three types of iris flowers: setosa, versicolor, and virginica. We can extract this data with pandas and visualize it with matplotlib.
Example CSV Data Set:
5.1,3.5,1.4,0.2,Iris-setosa
4.9,3.0,1.4,0.2,Iris-setosa
4.7,3.2,1.3,0.2,Iris-setosa
...
7.0,3.2,4.7,1.4,Iris-versicolor
6.4,3.2,4.5,1.5,Iris-versicolor
6.9,3.1,4.9,1.5,Iris-versicolor
...
6.3,3.3,6.0,2.5,Iris-virginica
5.8,2.7,5.1,1.9,Iris-virginica
7.1,3.0,5.9,2.1,Iris-virginica
main.py
import perceptron
import numpy as np
import pandas as pd
import matplotlib.pyplot as plt

# Get a CSV of the iris data set, returns a pandas DataFrame
# DataFrame is a 2d data structure with labeld axes
df = pd.read_csv("iris.data.csv", header=None)

# Pull out first 100 rows of data which is 50 setosa flowers and 50 versicolor flowers
# Set setosa = -1 and versicolor = 1 so we can classify them
# Also take col 1 (sepal length) and col 3 (petal length) and assign to feature matrix X

# get subset of first 100 rows and fourth column
y = df.iloc[0:100, 4].values
# reassign class label to -1 or 1
y = np.where(y == 'Iris-setosa', -1, 1)

# get sepal length and petal length cols
X = df.iloc[0:100, [0, 2]].values

# plot the data in a visual way
plt.scatter(X[:50, 0], X[:50, 1],
            color='red', marker='o', label='setosa')
plt.scatter(X[50:100, 0], X[50:100, 1],
            color='blue', marker='x', label='versicolor')
plt.xlabel('sepal length [cm]')
plt.ylabel('petal length [cm]')
plt.legend(loc='upper left')
plt.show()
This visualization shows how the petal length and sepal lengths of the two flowers we are comparing are clustered more clearly than just looking at the data.
Where there is overlap in the sepal length there is not in the petal length.
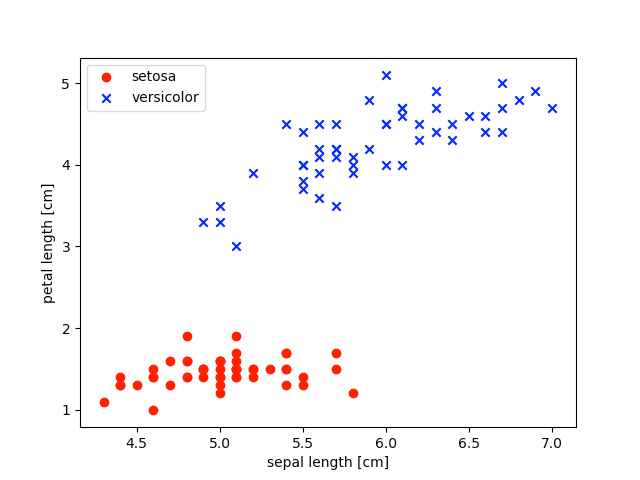
This 2D visualization shows that this specific data set should be linearly separable and therefore trainable for a single perceptron.